AstroCappella: Swift Song
How Far... How Powerful
An activity by Laura Whitlock, Kara Granger, and Padi Boyd
- Summary
- Activity 1: The Fall-Off of Light
- Background: Hubble's Law and Redshift
- Activity 2: The Keck Spectrum
Activity Summary
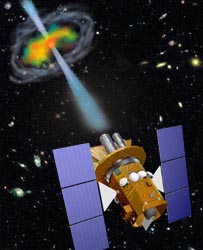
Gamma Ray Bursts: Take your students on a journey to the edge of space and time!
Gamma ray bursts are fast, intense bursts of gamma rays, the most energetic events in the universe. They travel clear across the universe from distant galaxies to our detectors in low Earth orbit. But how do we know how far away these objects are? By what methods do we measure how powerful they are?This collection of activities will allow you to journey with your students to these distant explosions, by following exactly the same procedures used by today's astronomers. Your students will review some basic physics concepts about light, learn about redshifted spectra and Hubble's Law, and use them to find out how far away, and how powerful, gamma ray bursts truly are. Your students will "be the astronomer!"
Students will work with a real optical spectrum of a gamma ray burst afterglow taken at the Keck Observatory. They will measure the shifts of spectral lines, deduce the velocity of the astronomical object, and then use Hubble's Law to get its distance. Finally, if we know how far away an object is, and how much energy it deposited on our detector, we can calculate how much energy was emitted at the source, using the "one over r-squared" fall-off relation of light.
These activities reinforce basic physics concepts (light, the electromagnetic spectrum) and chemistry concepts (spectral lines, spectroscopy). Students experience how these concepts are cast in a mathematical form, and how the concepts combine to answer a fundamental question about a mysterious phenomenon in our universe (process of science). They are most appropriately used in a 11th or 12th grade physics or chemistry class, but can be modified for use in a mathematics class, or with bright, motivated younger students.
To use these activities, follow the Activity Flow Chart. Specifically:
Step 1: Introduce the students to the big idea: what we know from stars and galaxies is all based on what we measure using detectors either on Earth or in orbit. How do we go from this information to an estimate of how far away the objects are, and how much power they are putting out? Let students brainstorm possible paths to these answers.
Step 2: Measure how light falls off with the Fall-off of Light Activity. Your class might break up into several groups, whose results could be averaged together. How close did your class come to the actual behavior of one over r-squared?
Step 3: Present the information found in Introduction to Hubble's Law and the Doppler Shift. The central, most important concept to get across is that Hubble discovered that the further a galaxy is from Earth, the greater its redshift - i.e. the faster it is receding from us. We can turn this idea around: if we measure the redshift of an object we can calculate its distance from Earth.
Step 4: Now, have your class perform the Keck Spectrum Activity. Students will use state-of-the art, timely astronomical data to measure the redshift of the gamma ray burst, and then use this information to estimate its distance from Earth. The final step of this activity applies the 1/r2 fall-off of light, the distance to the object, and the power measured at our detector, to estimate the total power emitted by the gamma ray burst.
Activity 1: The Fall-Off of Light
Objective
Your detector in orbit around Earth has measured a certain amount of energy from the direction of a faraway source. Your job is to determine how much energy the source actually emitted. Assume the source emits energy equally in all directions.Introduction
A light emits equally in all directions. What does this mean about the amount of light you will measure in any given square cm as you move further and further away from the light source?
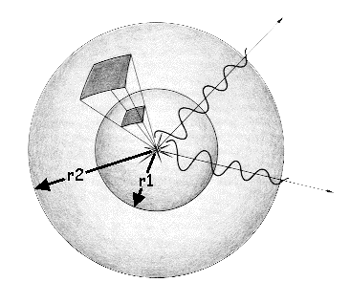
Think of light as a wave travelling away from the source. At a distance
r1 from the source, all the energy from the light is found on a spherical
surface with radius r1. The area of such a sphere would be 4 (r1)2. As
the wave continues to travel away from the source to a distance of
r2,
the light is then all found on a spherical surface whose area is
4(r2)2.
Keep in mind that the total amount of light emitted by the source, let's
call it L, is constant. What is changing as we move away from the source
is the area over which it is spread. Let us then compare the amount of
light per unit area at a distance of r1 to that at r2.
At r1, the light per unit area, L1, is equal to L/4 (r1)2. And at r2,
the light per unit area, L2, is equal to L/4(r2)2. Solving
each equation
for L gives us L= L1 x 4(r1)2 = L2 x 4(r2)2. So the amount
of light per
unit area at L1 relative to the amount of light per unit area at r2 is
then
(r1)2. As
the wave continues to travel away from the source to a distance of
r2,
the light is then all found on a spherical surface whose area is
4(r2)2.
Keep in mind that the total amount of light emitted by the source, let's
call it L, is constant. What is changing as we move away from the source
is the area over which it is spread. Let us then compare the amount of
light per unit area at a distance of r1 to that at r2.
At r1, the light per unit area, L1, is equal to L/4 (r1)2. And at r2,
the light per unit area, L2, is equal to L/4(r2)2. Solving
each equation
for L gives us L= L1 x 4(r1)2 = L2 x 4(r2)2. So the amount
of light per
unit area at L1 relative to the amount of light per unit area at r2 is
then
L1/L2 = (r2/r1)2
Think about what this means. If r1 is 5 cm and r2 is 10 cm, then there is 1/4 as much light per square cm at r2 as at r1. So the distance changed by a factor of 2, but the amount of light per square cm changed by a factor of 4. What if r1 was 5 and r2 was 50? How much less light per square cm do you have there?
Conclusion: We say that the intensity, or amount of light per square cm,
changes as 1/distance squared (i.e., 1/r2) away from the
source. How does
this help us to achieve our Objective? If we measure X amount of energy
per square cm in our detector, then we know that the source must have
emitted energy equal to 4r2 times X!
Now let's confirm it!
Want to convince yourself that light really does fall off as 1/r2? Here is a quick, easy way!
Materials
- scissors
- tape measure
- tape
- single-hole hole punch
- dark orange or dark red paper (at least 7 cm x 7 cm)
- flashlight
- with a well focused emission of light
- light end no more than 5cm in diameter
- data table
- graphics calculator
Procedure
- Find a blank, flat wall to shine a light onto and a table or chair that can stabilize the flashlight for this lab. If you have a nice blank wall near the end of a lab table, you can just put the light on top of the table. You will need to be able to move the light (whether along the table or by moving the chair) at least 1 meter in distance closer to or away from the wall.
- Use the hole punch to punch a hole in the center of the dark orange or dark red paper.
- Tape the paper to the light end of the flashlight, making sure the hole is roughly centered over the light.
- Place the flashlight on the chair or table at least 10 cm from the wall. You can adjust it with papers or books so that it is level (i.e., the light beam shines perpendicular on the wall). Measure the distance from the wall to the hole on the front of the flashlight. Record this distance in your data table.
- Turn the flashlight on. You should see a distinct white circle projected on the wall. The rest of the light emitted outside of this light should be a shade of the colored paper taped to the flashlight.
- Take 3 different measurements of the diameter of the circle of white light on the wall. HINT: Remember, the diameter of a circle is the longest measured chord from one edge of the circle to the other. Therefore, you know you've got the diameter when you hold one end of the tape measure on one side (edge) of the circle and get the largest measured value by moving the other end of the tape measure along the other side.
- Record these values in the data chart. Calculate the mean and record it as well.
- Move the chair with the flashlight (or move along the table) about 20cm further away from the wall. Measure the distance from the wall to the hole on the front of the flashlight. Record this distance on your data table.
- Repeat steps 6-8 at least two more times.
- Calculate the radius from each mean diameter. Record each calculation in the data table.
- Calculate the area of the circle formed from each calculated radius. Record each calculation in the data table. HINT: Area of a circle equals p r2.
- In your graphics calculator, enter the distance from the hole to the wall as one list and the area of each calculated circle as another list.
- Plot the data in the lists as a scatter plot. What kind of relationship do you see?
- Calculate a Power Regression equation on the two lists. What is the equation?
Introduction to Hubble's Law and the Doppler Shift for Activity 2
During the 1920's and 30's, Edwin Hubble discovered that the Universe is expanding, with galaxies moving away from each other at a velocity given by an expressionv = Ho * d
where v represents the galaxy's recessional velocity, d is its distance away from Earth, and Ho is a constant of proportionality called Hubble's Constant. This equation is known as Hubble's Law. The exact value of the Hubble Constant is still somewhat uncertain. Hubble's first determination of it was a value of 550 kilometers per second for every megaparsec in distance (km/sec/Mpc). Today, it is generally believed to be around 65 km/sec/Mpc. (A megaparsec is given by 1 Mpc = 3 x 10⁶ light-years). This means that a galaxy 1 Mpc away will be moving away from us at a speed of around 65 km/sec, while another galaxy 100 Mpc away will be receding at 100 times this speed. In essence, the Hubble Constant reflects the rate at which the Universe is expanding.
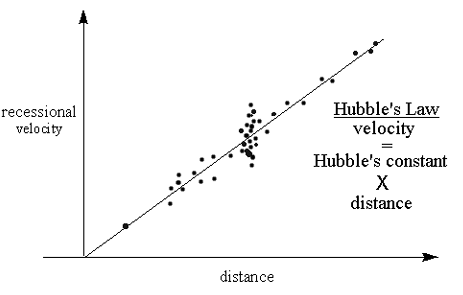
While there is certainly some scatter of measured observations off the line of best fit for Hubble's Law, it is nevertheless a good way to get a rough idea of how far away a very distant object is from Earth. All we need to do is to be able to determine the object's velocity.
The velocity is relatively easy for us to measure using the Doppler effect, or Doppler shift. An object in motion will have its radiation (i.e. light) shifted in wavelength according to the following formula:

where  = measured
wavelength,
= measured
wavelength,  is the
original (rest) wavelength, v is
the speed of the object and c is the speed of light. The quantity on the
left side of the equation above is usually called the redshift, and is
denoted by the letter "Z".
is the
original (rest) wavelength, v is
the speed of the object and c is the speed of light. The quantity on the
left side of the equation above is usually called the redshift, and is
denoted by the letter "Z".
Wavelengths can be measured in any units - Angstroms (10-10
meters), nm, mm, or km. As
long as  and
are in the same units, they will
cancel. The speed of light has a constant value of 300,000 km/sec. So,
to determine the velocity of a galaxy (in km/sec) from its spectrum, we
simply measure the wavelength shift of a known absorption line and solve
for v.
and
are in the same units, they will
cancel. The speed of light has a constant value of 300,000 km/sec. So,
to determine the velocity of a galaxy (in km/sec) from its spectrum, we
simply measure the wavelength shift of a known absorption line and solve
for v.
Example
A certain absorption line that is found at 5000 Angstroms in the lab is
found at 5050 Angstroms when analyzing the spectrum of a particular
galaxy. We then conclude that this galaxy is moving with a velocity v =
(50/5000) * c = 3000 km/sec away from us.
Putting it all together now, if the object is moving away from us at 3000 km/sec, its distance from us (according to the Hubble Law) is
d = v/Ho = 3000/65 = 46 Mpc or 1.4 x 10⁸ light-years
Activity 2: A Keck Spectrum
Objective
Using optical data of a gamma ray burst afterglow, measure the velocity of the object from the redshifts of its spectral lines. Using Hubble's Law, determine the distance to this object. Ultimately, estimate the power of the gamma ray burst from its measured flux at Earth and its distance from us. (Flux is the amount of energy flowing through a given area in a given time - usually one second).An Unsolved Mystery of the Space Age
Gamma ray bursts have been known to exist since 1969, but they present many mysteries. They last for only a few moments, and they come from random directions on the sky. Since a satellite first discovered them in the early days of Space Science, gamma ray bursts are often referred to as the great mystery of the Space Age.Another reason gamma ray bursts (GRBs) have remained so mysterious is that it is difficult to determine where they come from on the sky. Gamma rays are hard to focus, so for many years the uncertainty in the position of GRBs meant that looking for optical counterparts was like looking for a needle in a haystack. But recently the situation has improved.
On December 14, 1997, the BeppoSAX satellite measured the first 'afterglow' of a GRB, ushering in a new era of discovery of these powerful events. On July 3, 1998, astronomers at the Keck Telescope in Hawaii measured the optical afterglow of a GRB that contained many sharp spectral lines. We will use this spectrum and measure several spectral lines to determine the redshift of this object. From its redshift, and our understanding of the expansion of the universe we will measure the distance to this GRB, and ultimately the power of this explosion.
Data Analysis
Keck is a pair of telescopes perched on the peak of Mauna Kea, Hawaii. They are the largest optical telescopes in the world, and their location high above much of the atmosphere provides the best observing conditions on Earth. On July 3, 1998 Keck II obtained the spectrum of the glowing remains of a gamma ray burst before it faded from our view forever. The spectrum shows the energy distribution of the light from the GRB.In the plot, the flux in micro-Janskys (�Jy) is shown as a function of wavelength measured in Angstroms. We see a smooth energy distribution with several lines on top. These lines come from atomic transitions of elements in astronomical sources. Their relative spacing is determined only by the atom giving rise to the line. The lines marked Hd and Hg are due to neutral hydrogen. O II is from ionized oxygen. The 'rest' wavelengths at which these transitions occur in the lab are marked on the plot. The motion of the galaxy away from us, Doppler shifts the lines from their rest wavelengths.
Using any straight-edge, measure the wavelengths of the sharp Hd, Hg and
O II lines in the spectrum, and record these in the table. Calculate
the difference
= ( - ), and the redshift (/) . In the
steps below, use the average redshift of the three lines to estimate the
distance to this gamma ray burst and the power it emitted.
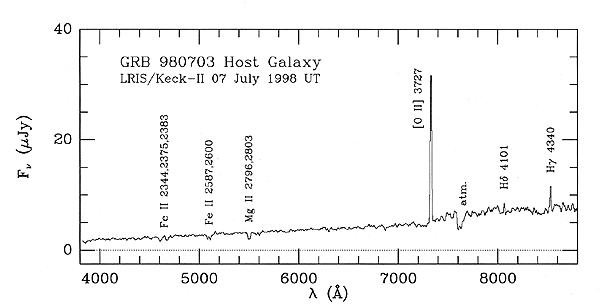
A larger version of this plot is available.
| ||||||||||||||||||||
ResultsAverage Redshift R : _________ Average Velocity = R x 3 x 10⁵ km/sec : ___________ Average distance: D=V / 65 km/sec/Mpc : ________________ Distance in cm: 1 Mpc = 3.26 x 10⁶ ly, 1 ly = 9.5 x 10¹² km, 1 km = 105 cm Power Emitted: P = 4 |
Discussion
The final step of this activity applies the 1/r2 fall-off of light, the distance to the object, and the power measured at our detector, to estimate the total power emitted by the gamma ray burst. Have students look up power emitted by more familiar events (an explosion, lighting a match, a 100 W light bulb are some examples). Explain that gamma ray bursts are very far away (we call these distances "cosmological distances") and they are the most powerful explosions in the universe.
Reference
Additional Resources:
Hubble's Law
- http://csep10.phys.utk.edu/astr162/lect/cosmology/hubble_constant.html
- http://astrosun.tn.cornell.edu/courses/astro201/hubbles_law.htm
- http://einstein.uhh.hawaii.edu/spacegrant/lab5/lab5.html
Doppler Shift
- Doppler Shifting - the song
- http://www.astro.ucla.edu/~wright/doppler.htm
- http://zebu.uoregon.edu/~soper/Light/doppler.html
For More Information on Gamma Ray Bursts:
The Gamma-Ray Universe. D. Kniffen in American Scientist, Vol. 81, No. 4, pages 342-350; July 1993.
The Compton Gamma Ray Observatory. Neil Gehrels, Carl E. Fichtel, Gerald J. Fishman, James D. Kurfess and Volker Schonfelder in SCIENTIFIC AMERICAN, Vol. 269, No. 6, pages 68-77; December 1993.
The Gamma-Ray Burst Mystery. D. H. Hartmann in The Lives of Neutron Stars. Edited by A. Alpar, U. Kiziloglu and J. van Paradijs. NATO Advanced Studies Institute, Kluwer Academic Publishers, 1994.
Gamma Ray Bursts. G. J. Fishman and C. A. Meegan in Annual Review of Astronomy and Astrophysics, Vol. 33, pages 415-458; 1995.
BeppoSAX Mission home page is available on the World Wide Web at http://www.sdc.asi.it/